
August 13, 2021
Albert Einstein famously remarked that “compound interest is the eighth wonder of the world.” What does this mean? An investment is made, time passes, and interest is earned, which increases the principal amount each year. This results in even more interest generated, because of the ever-increasing principal. Over time, this sustained cycle drives ever-greater wealth.
Financial advisors have not, however, named an opposite to compound interest. What happens when, over periods of time, yields are in a negative range and the principal actually decreases? And what does this have to do with K–12 education? Well, the new, full-year edition of Renaissance’s How Kids Are Performing report is now available, and the findings reveal how consecutive seasons of below-typical growth have impacted students’ reading and math performance.
Before reviewing the new report’s findings, I want to acknowledge that we all may be suffering from a bit of pandemic fatigue. We may have even grown numb to news of the pandemic’s impact on education. Our initial How Kids Are Performing report, released last fall, received wide media coverage. The winter edition of the report received somewhat less coverage. The new, full-year edition—much like recent reports from other assessment providers—has received hardly any.
In allowing ourselves to become numb to the ongoing academic impacts of the COVID-19 pandemic, we are running a tremendous risk. We risk losing our sense of urgency—a driving need to take immediate action. In his book Leading Change, leadership expert John Kotter notes how difficult “it is to drive people out of their comfort zones,” and that “without a sense of urgency, people won’t give that extra effort which is often essential” for substantive change to occur. And in the How Kids Are Performing report, there are several findings that point to necessary challenges and changes as we begin the new school year.
Multiple seasons of below-typical growth
The new report examines Star Assessments data from 3.3 million students nationwide—the largest longitudinal data set among the recent reports. At the highest level, our analysis found one more “season” of slightly below-typical growth. Our key metric related to growth is Student Growth Percentile (SGP), which depicts growth on a scale from 1–99, where 50 reflects an average rate of growth. Scores above 50 represent above-typical growth and scores below 50 represent below-typical growth.
In a typical year, mean SGPs for large groups of students hover right around 50. In Fall 2019, for example, the mean SGP for mathematics for the 3.3 million students included in the How Kids Are Performing analysis was 50. When we disaggregated the data by grade level, we found slight variances. Some grades had an SGP of 51 or 52, while others had an SGP of 49 or 48—some slightly above and others slightly below the mean.
In contrast, the mean SGP for mathematics across grades 2–8 in Spring 2021 was 45. Every grade had an SGP below 50, with some as low as 41. For reading, the mean SGP was also 45 across grades 1–8, with most grades ranging from 44–46. It’s important to note that an SGP of 45—during a year when schools faced so many disruptions and challenges—is understandable, and even commendable. However, consecutive seasons of below-typical growth have caused reading and math performance to fall progressively further behind pre-pandemic expectations.
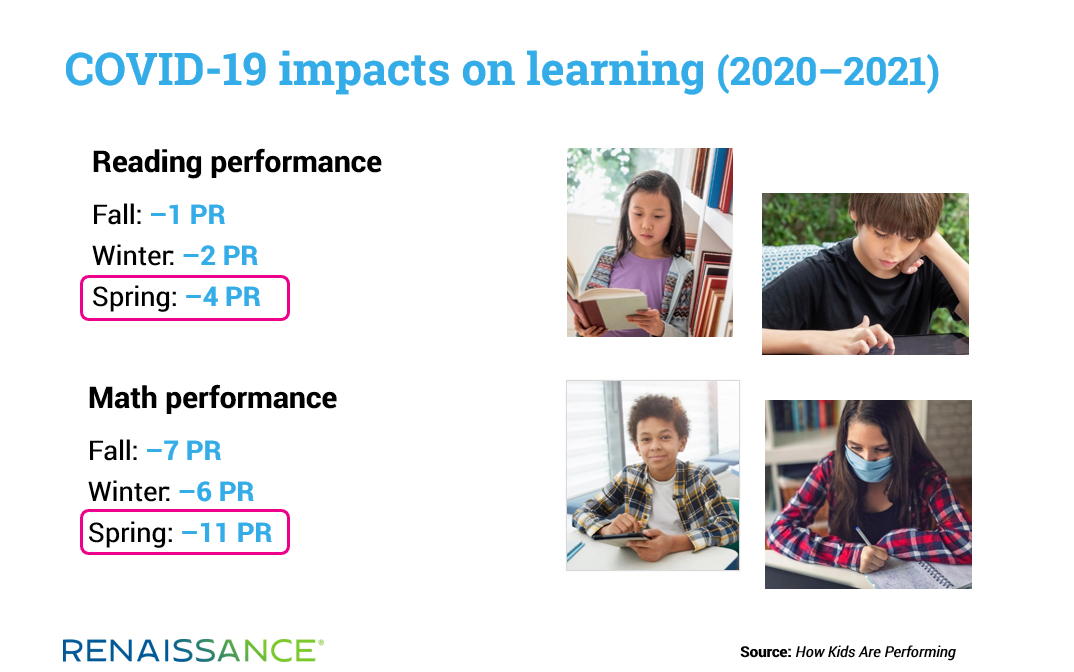
How far behind? As students began the 2020–2021 school year, we estimated they were about 1 percentile rank (PR) point behind where they typically performed in reading. By winter, they had fallen to 2 points behind and now, with the school year complete, we estimate them to be 4 points behind. In mathematics, things are more dire. Students began the 2020–2021 school year about 7 percentile rank points behind. By the winter, they had advanced slightly to 6 points behind but, as the year wrapped up, they finished, on average, 11 points behind.
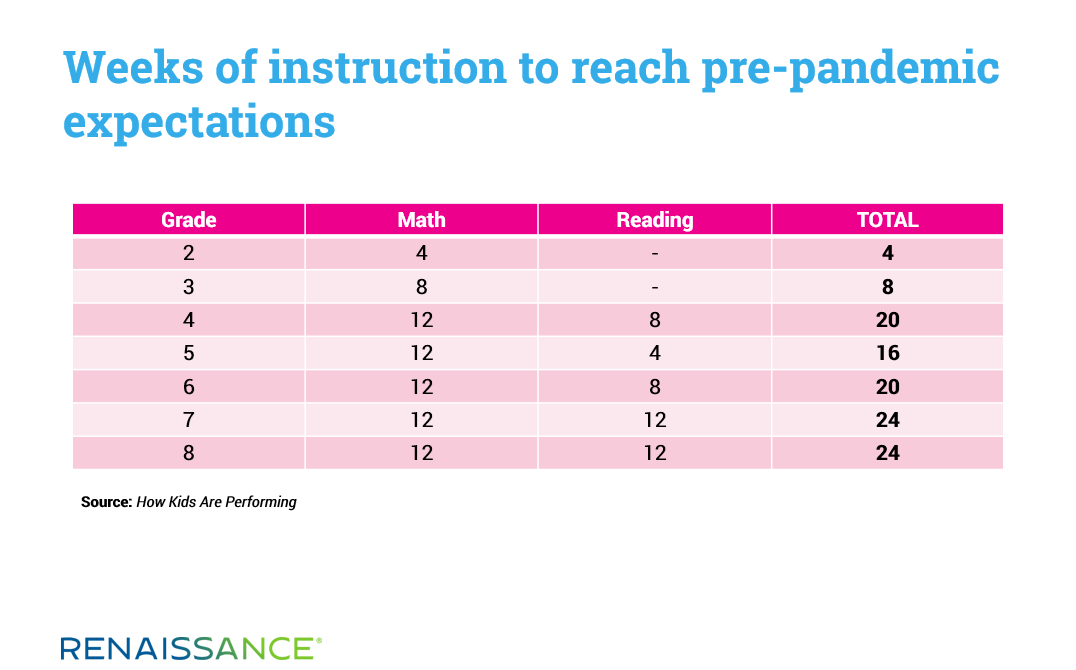
We then converted the Spring 2021 numbers to an estimate of how many weeks of instruction (meaning, a daily class in math or reading for 5 days) would be needed to catch students up to pre-pandemic levels of performance. We found that, in the most impacted grades (grades 4, 6, 7, and 8), as many as 12 or more weeks might be necessary in each subject area, creating the need for a total of 20–24 additional weeks of instruction to catch up in both reading and math.
Different realities for different student groups
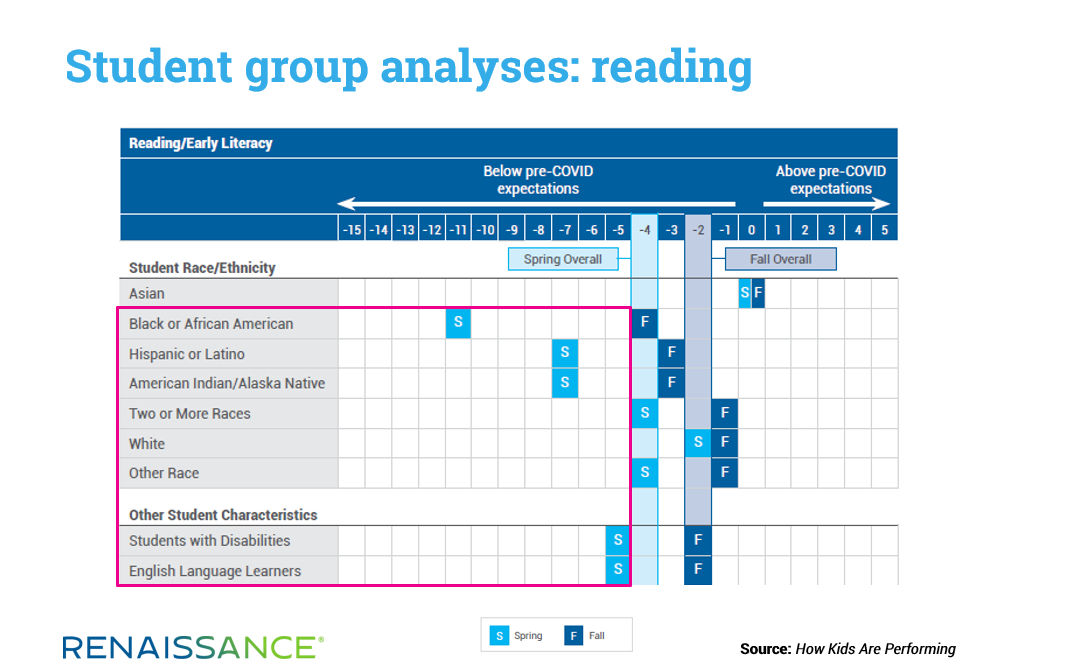
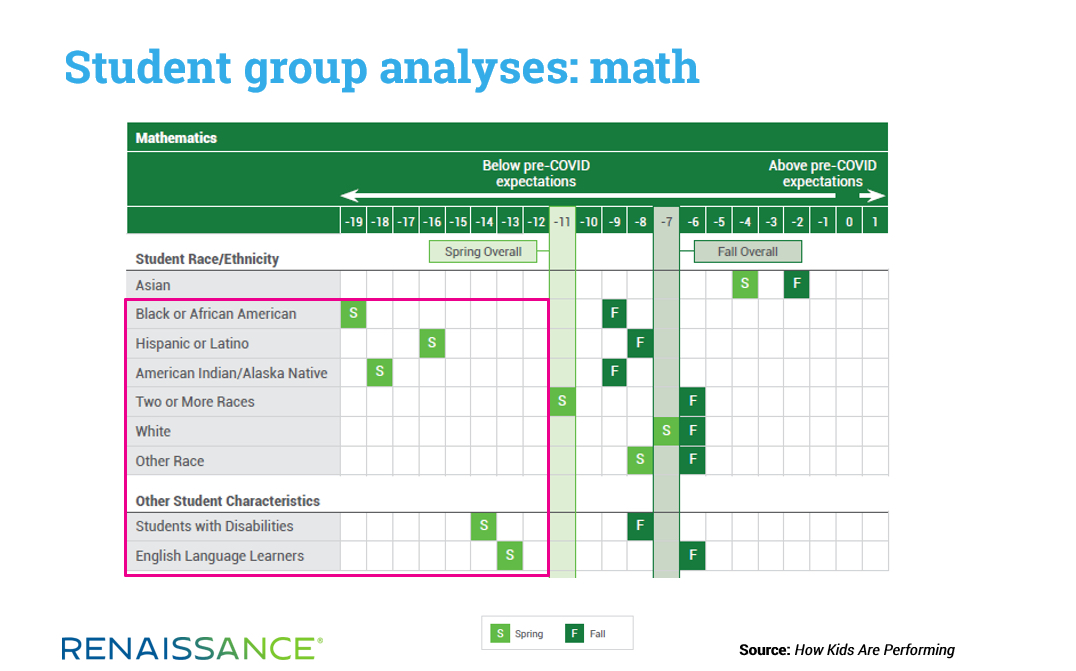
The new report’s starkest findings were revealed when the overall changes in performance were disaggregated for different student groups, as shown in the two graphs below (which show impacts in terms of percentile rank points). When we analyzed the growth data by racial/ethnic group we found that—while all groups demonstrated rates of growth that were below pre-pandemic baselines—growth among Black, Hispanic, and American Indian or Alaska Native students was further below the overall median than all other racial/ethnic groups in both reading and math. In reading, growth was 6–8 points below pre-pandemic baselines for Black, Hispanic, and American Indian or Alaska Native students. In math, growth was 11–14 points below pre-pandemic baselines for these students.
Similarly, growth for students with disabilities and English Language Learners was below the overall median, as was growth for schools categorized as Title I Schoolwide, and for students testing outside of school. When the data are considered by school locale, urban schools exhibited the lowest growth rate, while rural schools exhibited the highest.
Identifying instructional implications and next steps
While we could drill into additional analyses from the report, the danger is that we’d spend so much time framing the problem that we wouldn’t leave enough to address students’ needs. For this reason, I’ll spend the remainder of this blog considering how we might best address the harsh realities of decreased levels of performance and disproportionate impact on some student groups. In terms of next steps and instructional implications, I’ll suggest the following:
- Disaggregate your data. If you can’t see equity gaps, you can’t address them.
- Implement strategies for “accelerated learning,” rather than taking a remediation approach.
- When addressing drops in mathematics performance, be sure to consider the Trip Steps—those skills that are unusually difficult for students to learn.
- Implement strategies and practices shown to be effective for marginalized students.
#1. Disaggregate your data by student group
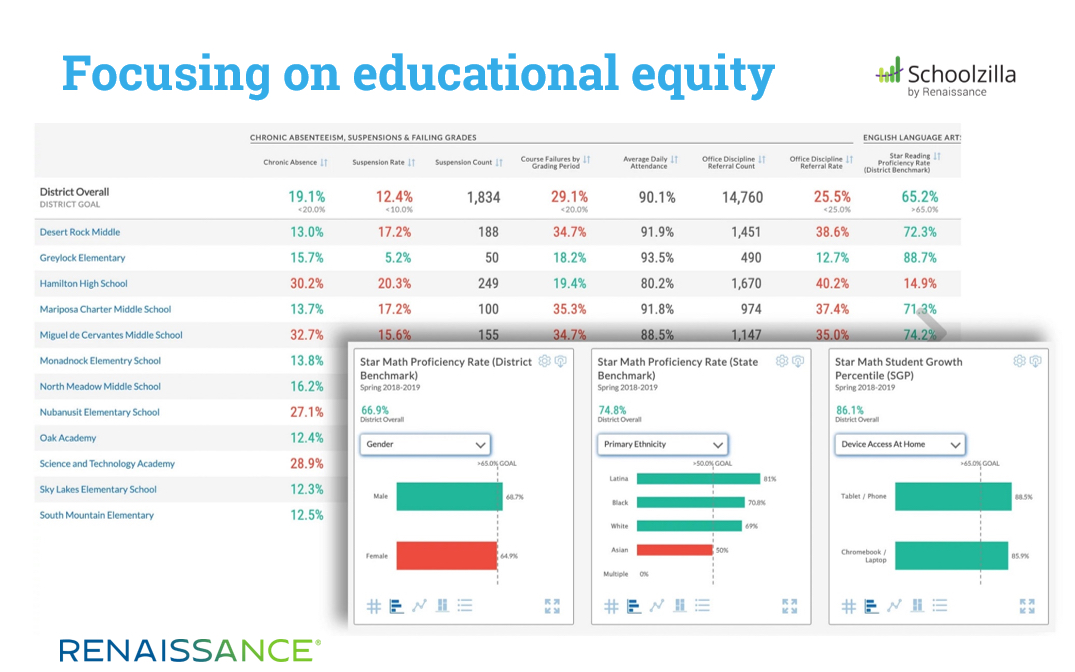
The disparity in performance among demographic groups is a vivid illustration of how disaggregation by multiple metrics is critical for revealing equity issues. Having assessment data is one thing, but finding equity issues requires the ability to associate this data with other critical information and student demographics in order to get a more complete picture.
Working on the How Kids Are Performing series has revealed that some schools face obstacles in bringing together information from a variety of sources (e.g., interim assessment tools, student information system [SIS], etc.) Within our data sample, only about half of the schools have demographic data fields populated in Star Assessments. Said another way, only one-half of the schools we work with could break their interim assessment data down in any significant way.
Too often, interim assessment systems like Star operate separately from instructional and practice programs, and they are rarely connected with the school’s SIS, which houses essential demographic details. Data warehousing and visualization platforms—including Schoolzilla by Renaissance—can be particularly useful in helping you to more fully explore all available metrics.
#2. Implement “accelerated learning” strategies
Once equity issues and areas in need of attention are identified, the focus can turn to planning instruction. A significant shift is occurring around approaches to take when students are performing below grade-level expectations. Historically, our approach has often been remediation, but many experts and groups are now advocating for a collection of approaches referred to as “accelerated learning.” This umbrella term, with several specific approaches related to it, is included in back-to-school guidance from the US Department of Education and appears in many states’ guidance documents as well.
A primary emphasis of accelerated learning is maximizing the time students spend with grade-level content through a purposeful consideration of essential prerequisite skills and targeted “just-in-time” instruction and support. Within this approach, knowledge of essential grade-level skills and necessary prerequisite skills is crucial. Renaissance’s free Focus Skills Resource Center provides detailed information on both essential grade-level skills and the necessary prerequisites, and these resources have recently been expanded to include Focus Skills for Spanish reading as well.
#3. Understand Trip Steps in Mathematics
The content area where performance has been most impacted by COVID-related disruptions is math. While working to accelerate learning in this area, knowledge of the most difficult skills for students to master at each grade level is especially helpful. Through the empirical validation process that we use to craft our learning progressions, we identified a subset of particularly difficult math skills from pre-K through Algebra 1. We refer to these skills as Trip Steps, which you can see by clicking here.
Why did we choose this name? If learning is a staircase, then all steps are not created equal. In mathematics particularly, some skills are extraordinarily difficult to master. We call these Trip Steps because they can cause a stumble in learning, just as an extraordinarily tall step in a staircase can cause an awkward or strained bit of climbing.
Educators who better understand the challenge reflected by Trip Steps—which are generally not visible in standards documents or curricula—can be better prepared to ready learners for meaningful engagement with and smoother ascent toward mastery of these difficult skills.
#4. Use effective practices to support marginalized students
As mentioned earlier, our results show that the pandemic has disproportionately impacted educational outcomes for certain student groups, with the largest impacts for Black or African American students, and for American Indian or Alaska Native students. For this reason, our instructional interventions should be disproportionately targeted to those in greatest need. We strongly encourage schools to explore instructional and pedagogical approaches that are research-based as effective practices for marginalized groups.
Two helpful resources for getting started are The New Teacher Project’s COVID-19 School Response Toolkit and the work of educator and author Horacio Sanchez. You’ll also find information and resources online about culturally responsive teaching (CRT) practices, which reflect and build upon the work of Gloria Ladson-Billings and others. A recent report from New America Foundation describes the 8 competencies of culturally responsive educators.
Understanding important lessons from history
While it’s been more than a century since we dealt with the last global pandemic, the period we’re in now is not the first with major disruptions to schooling. During World War II, fully one-third of the educators in US schools left to enter military service or perform other war-related work. Across Europe, as many as 75 percent of school buildings were damaged, destroyed, or put to some other use. And during polio outbreaks in the 1940s and 1950s, radio-based instruction was the only “remote learning” option available.
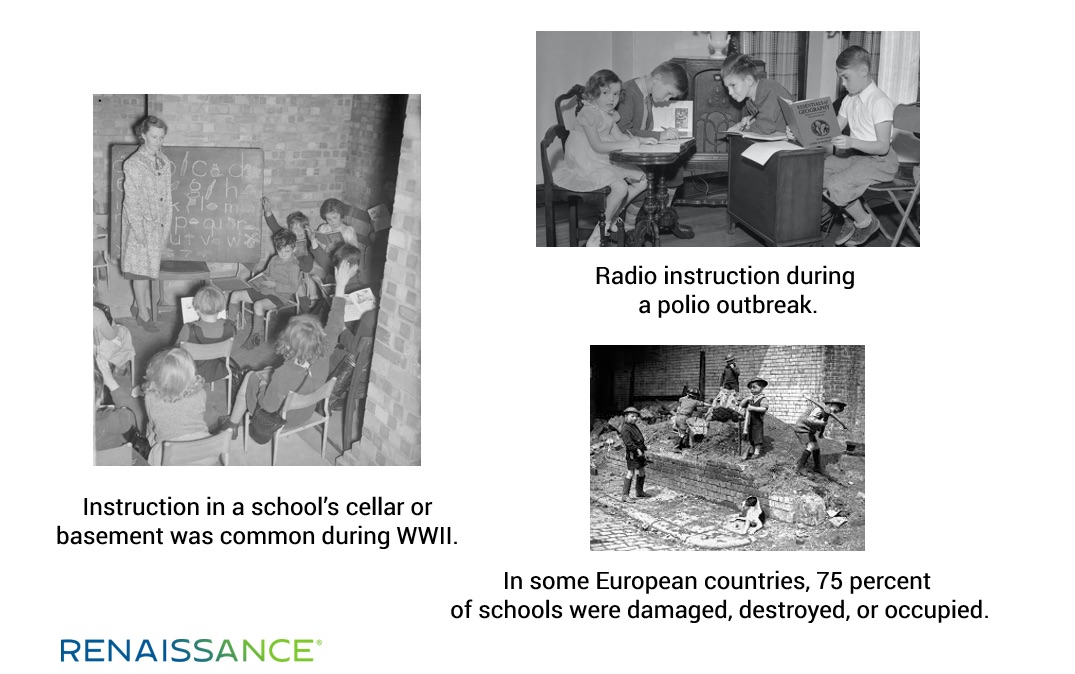
When we take this historical perspective, we find that, though we’ve faced many challenges over the past 18 months, we’ve had it better than some of our predecessors. Our school buildings are intact. When we’ve been able to be in them, we weren’t taking shelter in the basement. And though we may have struggled with Zoom or other remote teaching tools, they’re far more interactive and dynamic than the one-way, audio-only communication provided by radio.
Things have not been easy for us, but neither were they easy for our parents, grandparents, or great-grandparents. Educators of earlier generations were asked to shepherd children through other major disruptions, and the current challenges are simply the ones that befall us. It’s noble work that we do in striving to best address these challenges. Our predecessors in the 1940s earned the mantle of “The Greatest Generation.” I pray that history will judge us at least half as favorably.
Learn more
Download the full-year edition of How Kids Are Performing for additional insights on the most urgent instructional needs this year. Also, watch Dr. Kerns’ new webinar for more in-depth discussion of proven strategies to accelerate student learning.
About the author

Gene Kerns
Gene Kerns, EdD, is Vice President and Chief Academic Officer at Renaissance and a nationally acclaimed speaker on assessment, learning progressions, and educational standards. He is co-author of the book Literacy Reframed: How a Focus on Decoding, Vocabulary, and Background Knowledge Improves Reading Comprehension (2020).