Comprehensive Insights

Answer essential questions about performance

Visualize

Visualize all your key data in one place and gain insights into performance at the district, school, and student level no matter where learning takes place — either at home or in the classroom.

  • Use configurable goals to keep your district’s vision clear, present, and measurable
  • View progress across schools to identify bright spots or schools in need of additional support
  • See how students across the district are performing in relation to your most important data metrics
Schoolzilla Absenteeism District Profile screenshot.
Schoolzilla Absenteeism Our Schools screenshot.
Schoolzilla Absenteeism Our Students screenshot.

Monitor

Easily see successes and areas for growth by monitoring performance and progress across metrics.

  • Track progress and continuously improve individual school performance across multiple measures with school-specific goals
  • Create groups to continually measure student progress across multiple metrics to ensure students are staying on track
  • Quickly see what’s behind an individual student’s performance gaps to help pinpoint support
Schoolzilla Absenteeism Desert Rock Middle School screenshot.
Schoolzilla Absenteeism District Overview screenshot.
Schoolzilla Absenteeism Student Profile screenshot.

Analyze

Use interactive charts to quickly assess how your students are doing in key areas and identify where support is needed most.

  • Dig deeper into strand-level data, explore performance for up to five years, and use multiple filters to focus in on specific groups of students
  • View daily data to quickly spot highs and lows and see patterns based on day of the week
Star Math Proficiency Rate District Benchmark screenshot
Star Math Proficiency Rate District Benchmark percentage chart screenshot
Schoolzilla Proficiency Rate District Benchmark Average Daily Attendance screenshot

How it works

How does Schoolzilla work?

1

Integrate

Schoolzilla automatically integrates data from your student information system, online learning products, assessment system, and more.

2

Track

Easy-to-use dashboards show you daily progress toward your strategic goals at every level, from whole district to individual student.

3

Identify

Interactive charts enable you to quickly identify gaps and celebrate growth for schools and students.

4

Share

Data visualizations help you demonstrate progress to your team, school board, and community.

DATA SPOTLIGHTS

Making trends in your data easier to spot

Academic achievement

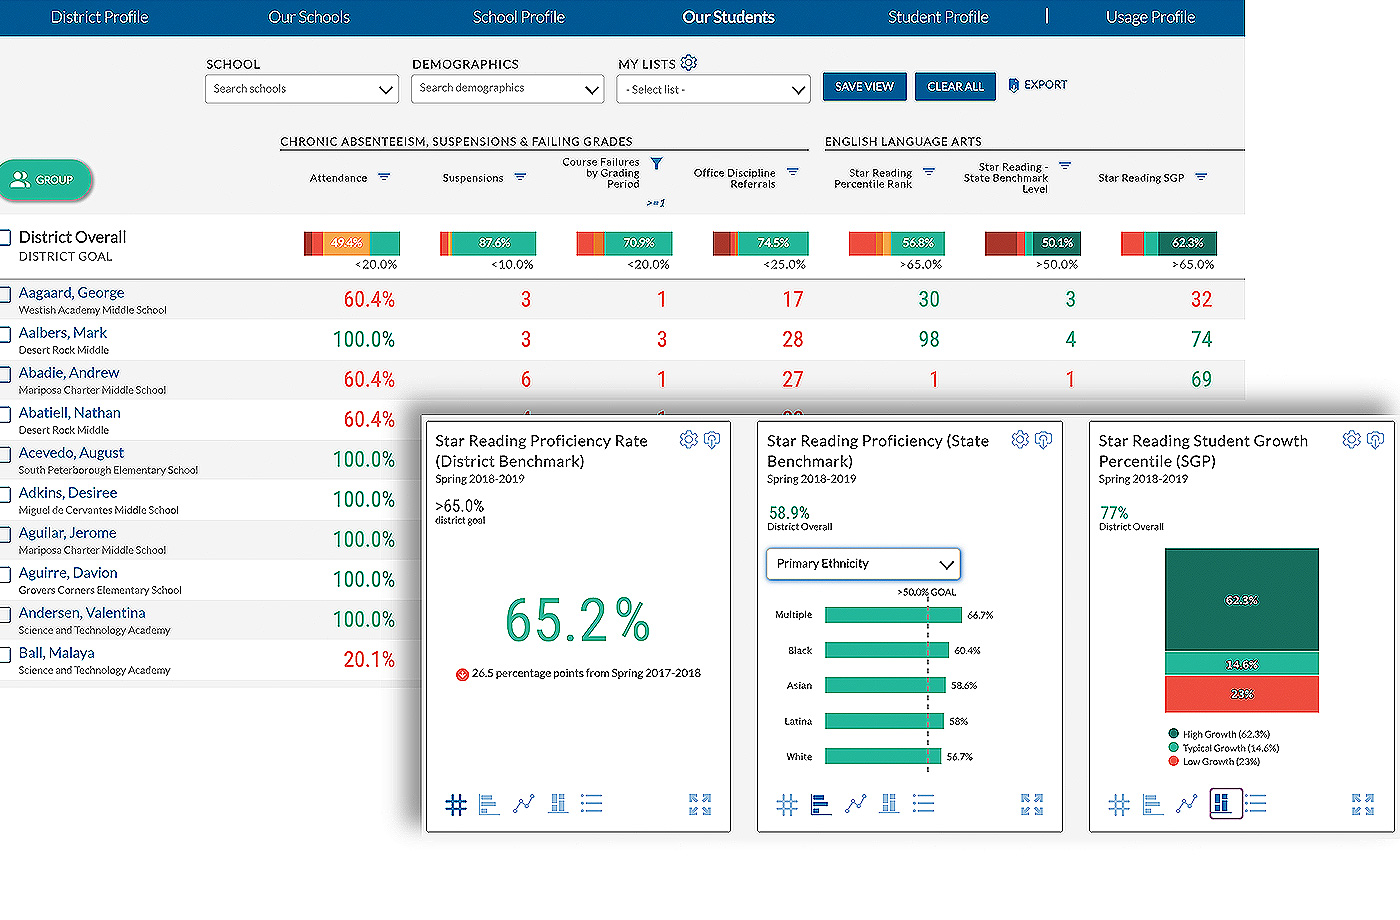
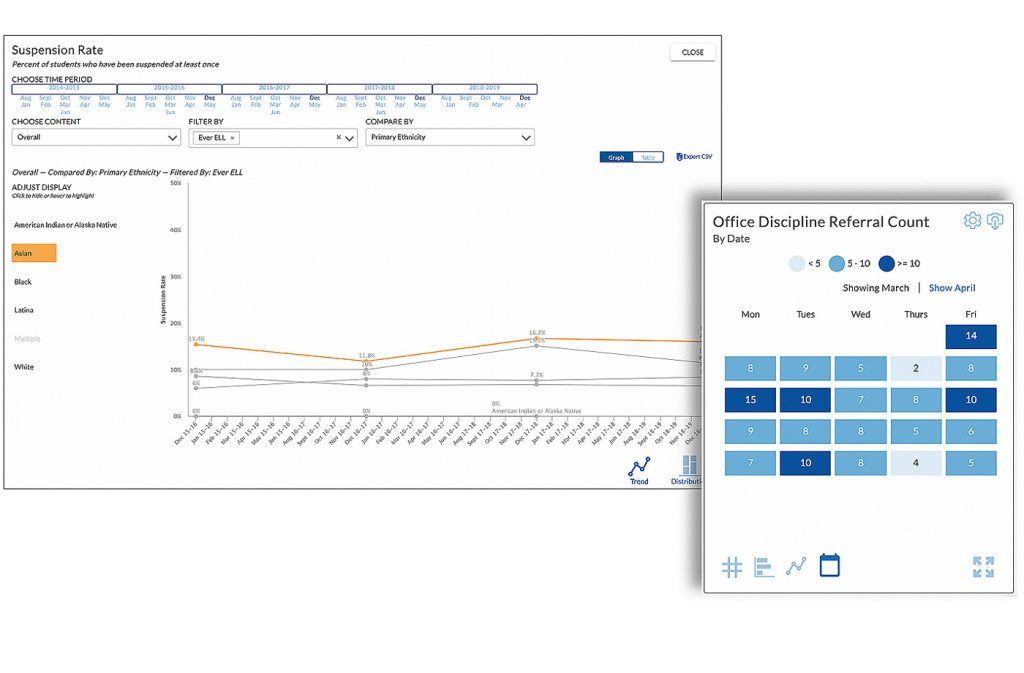
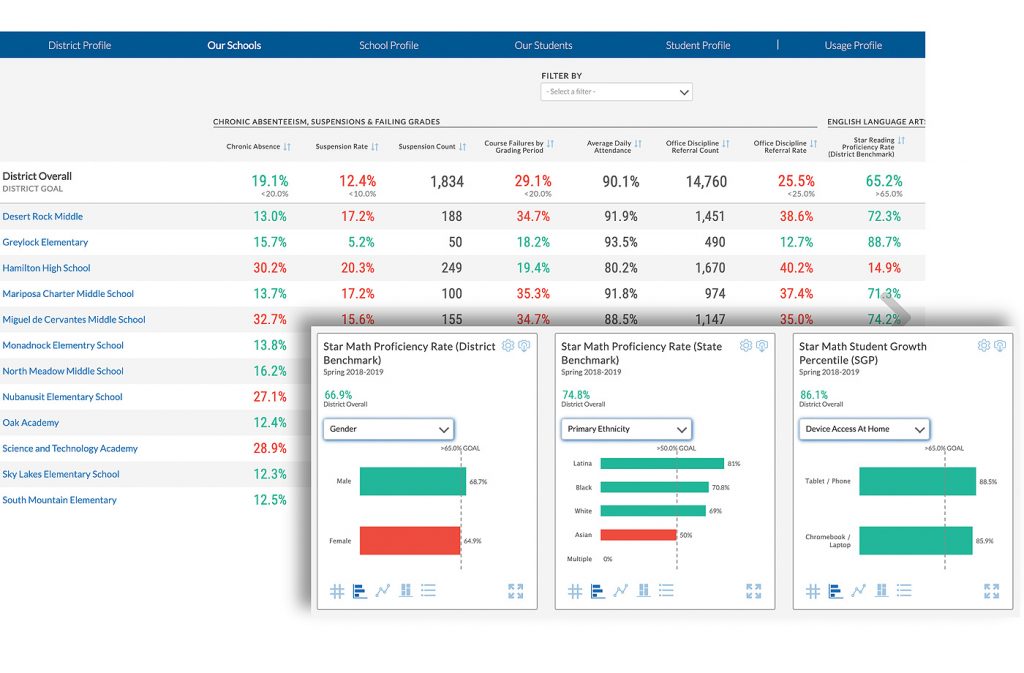
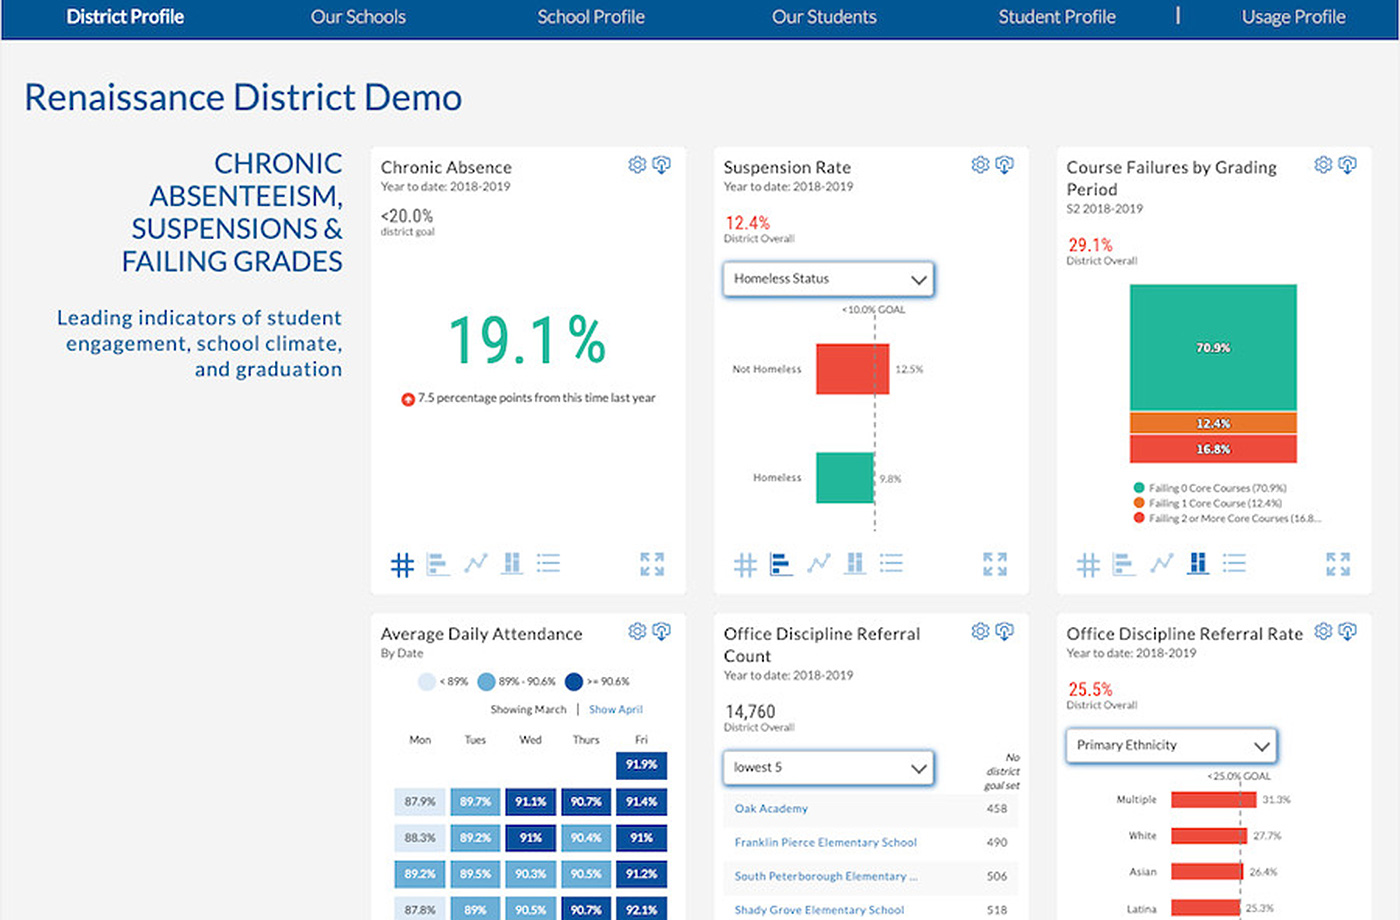
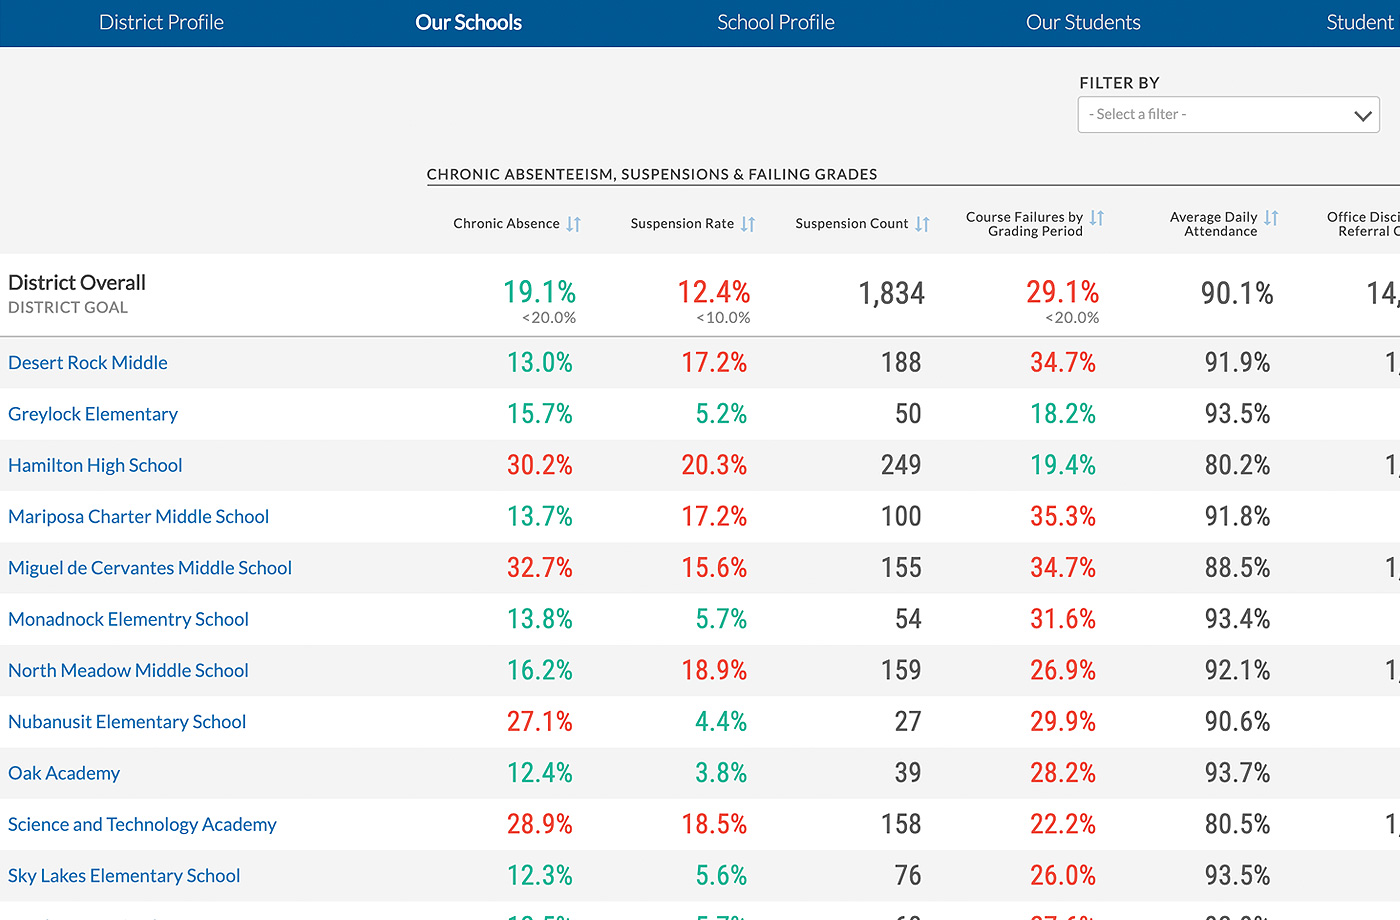
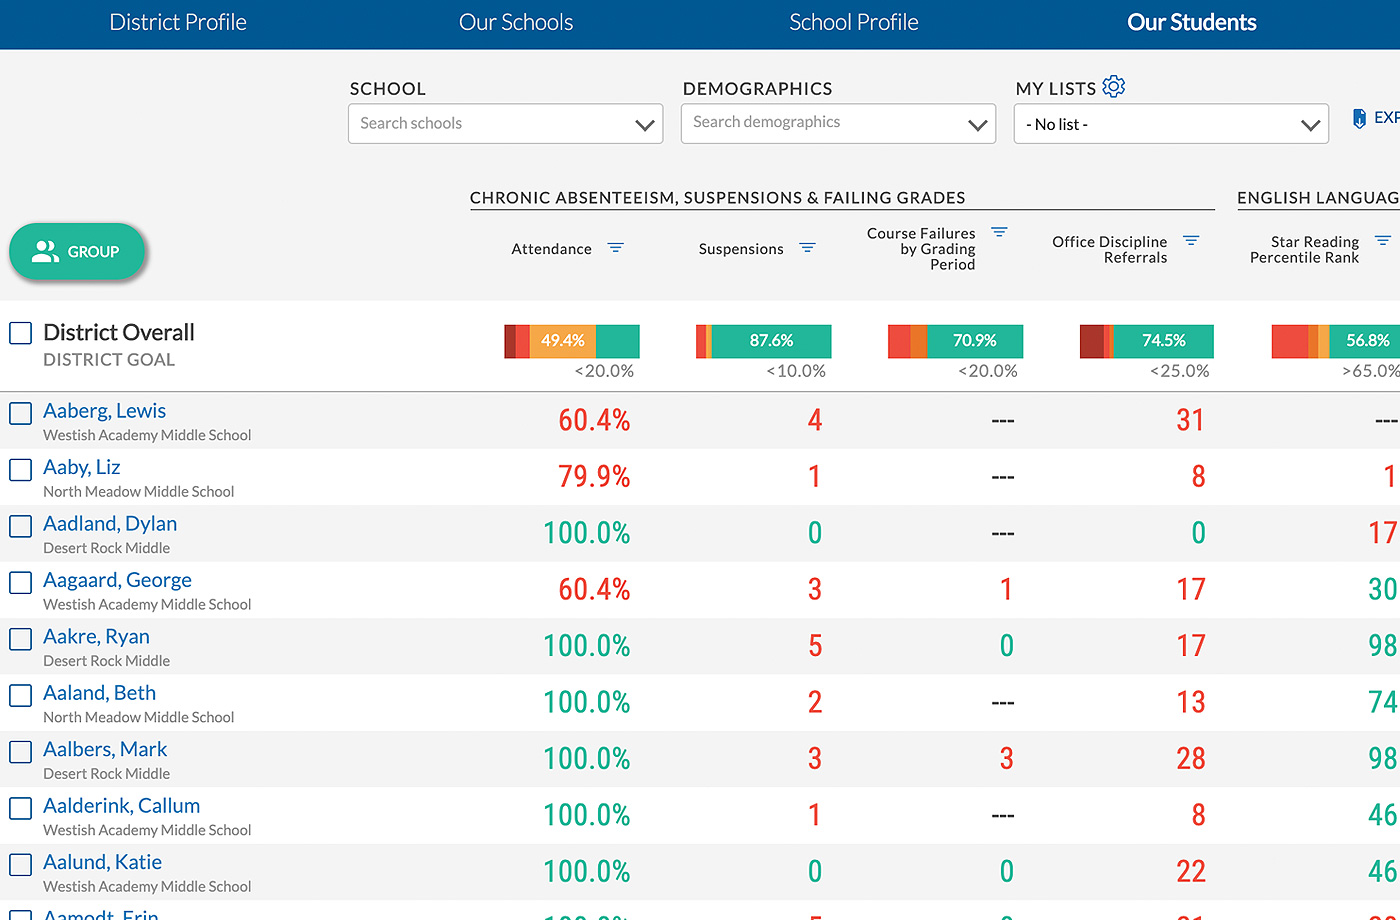
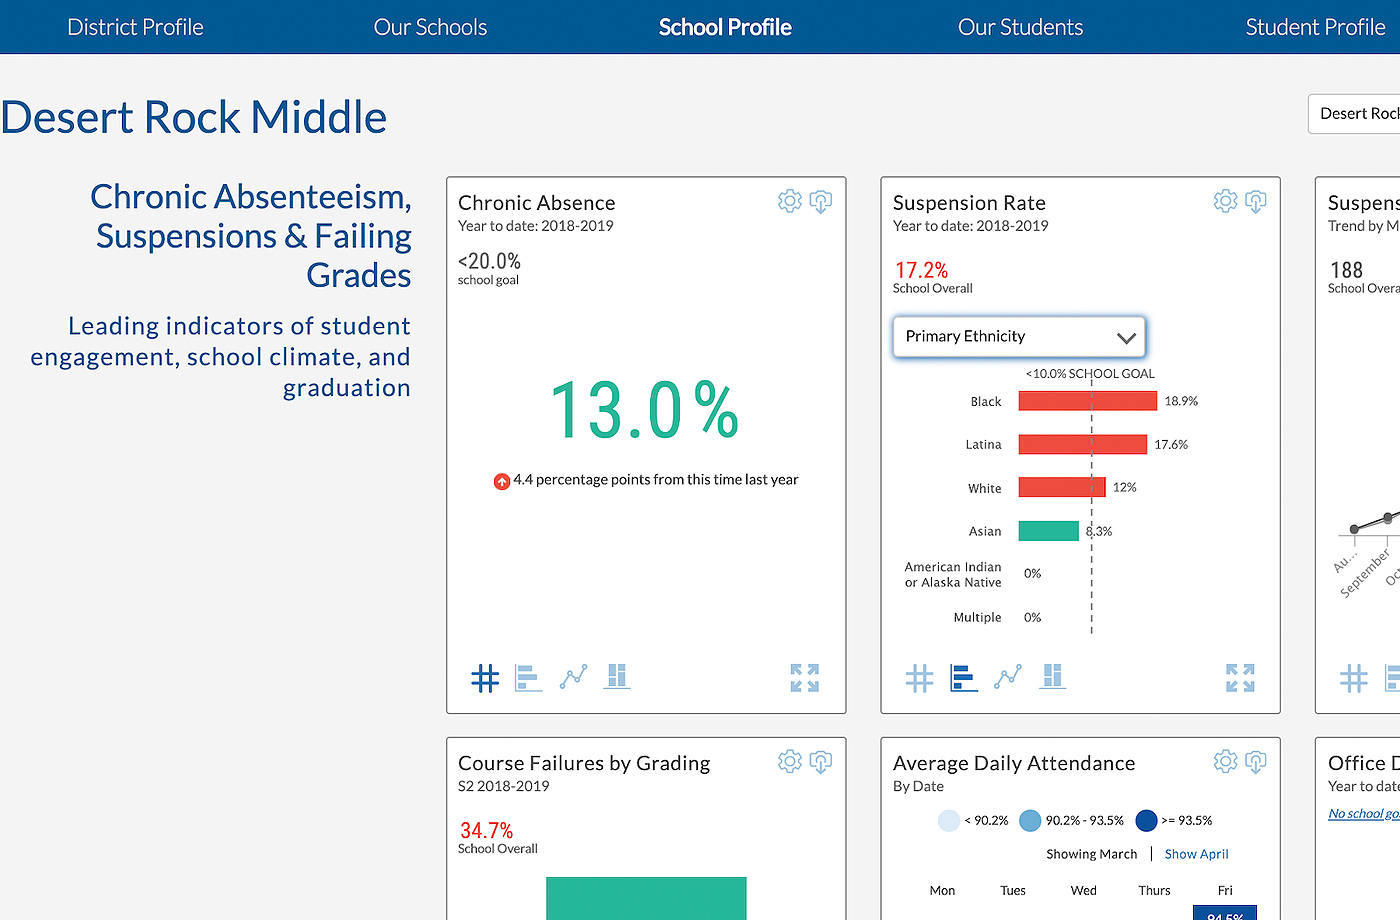
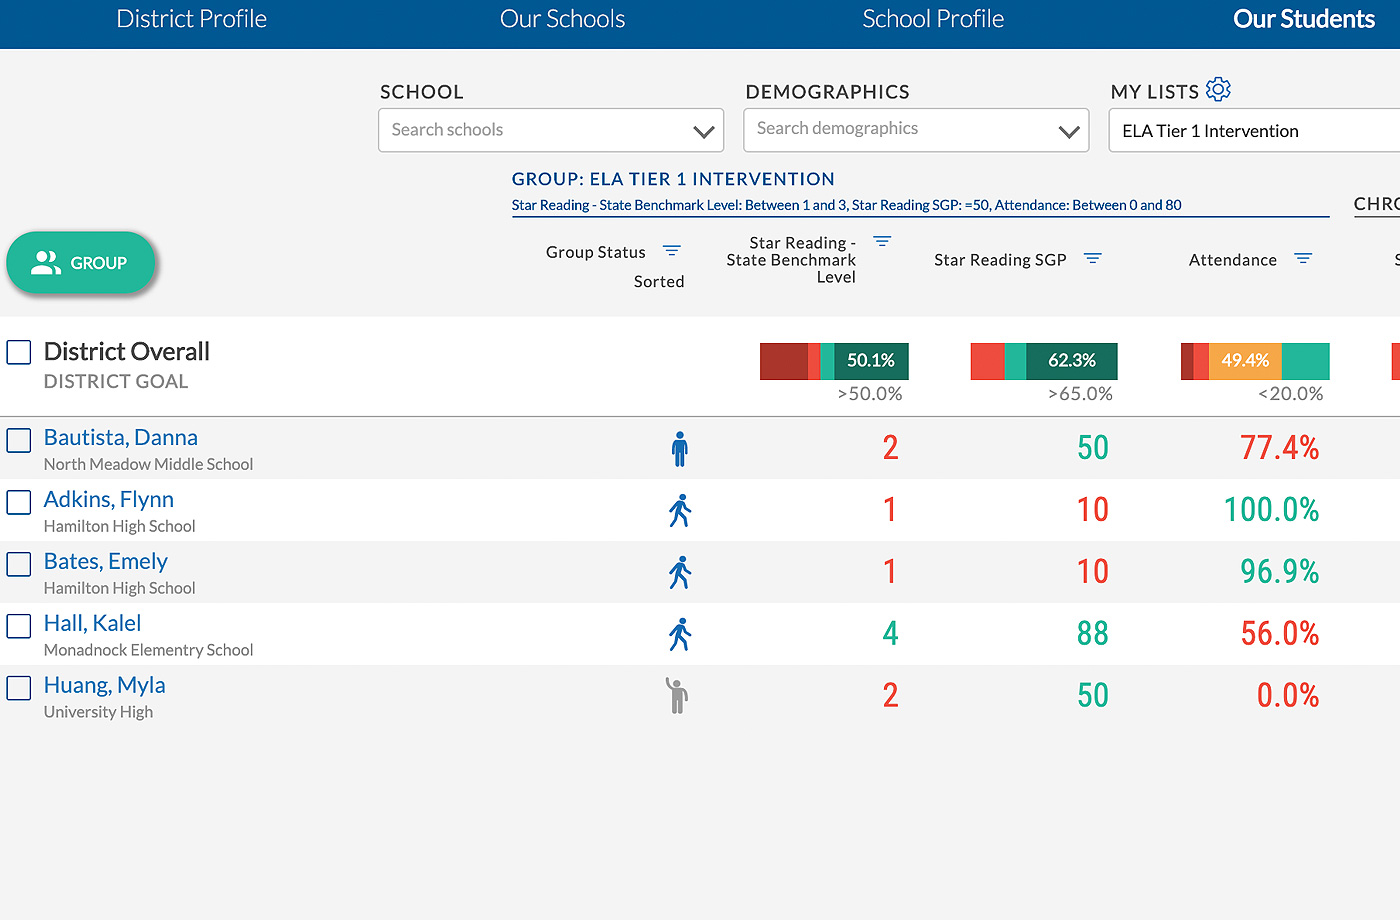
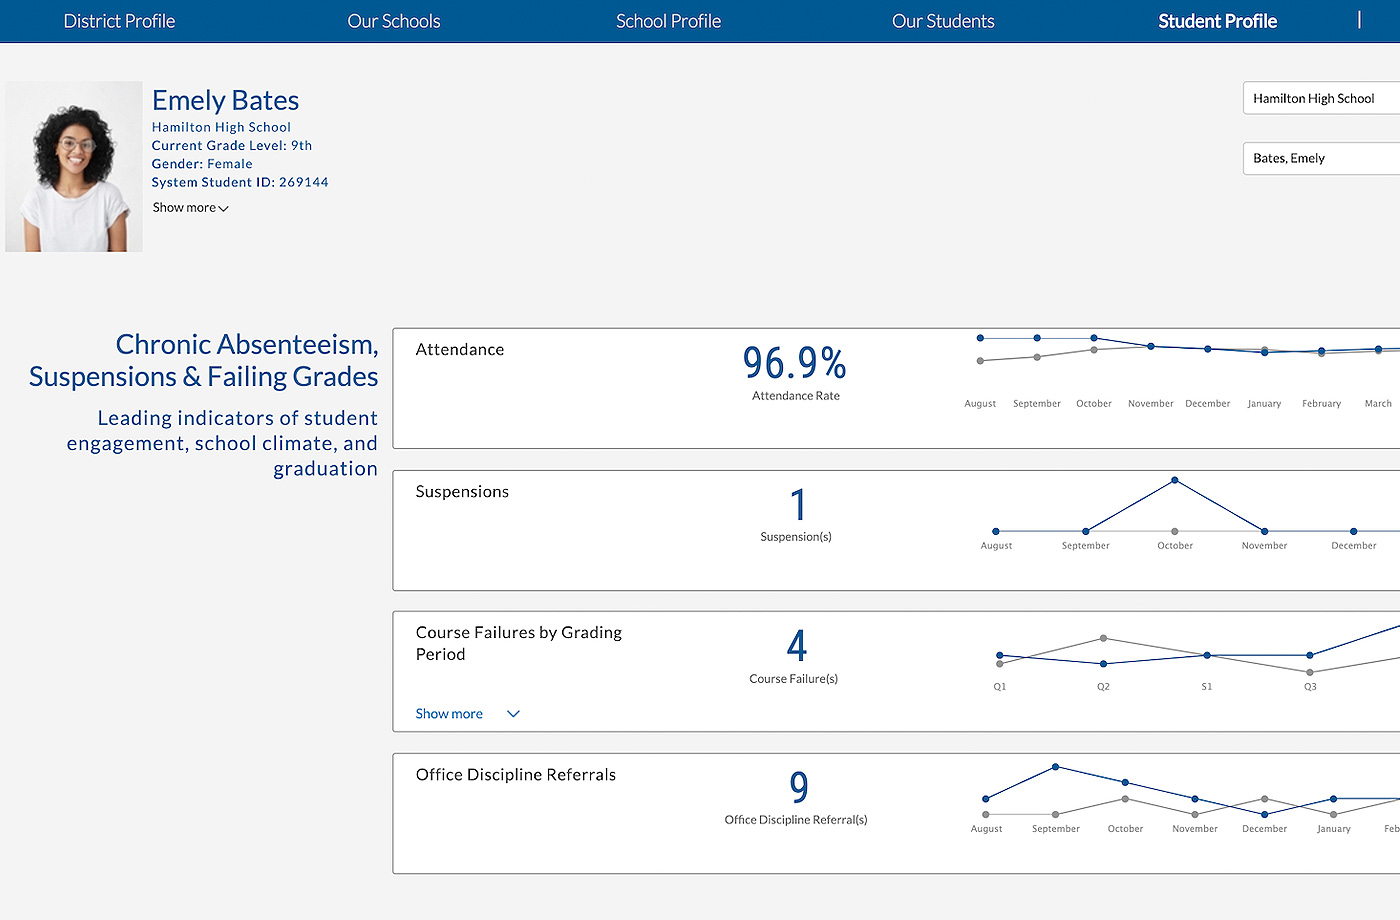
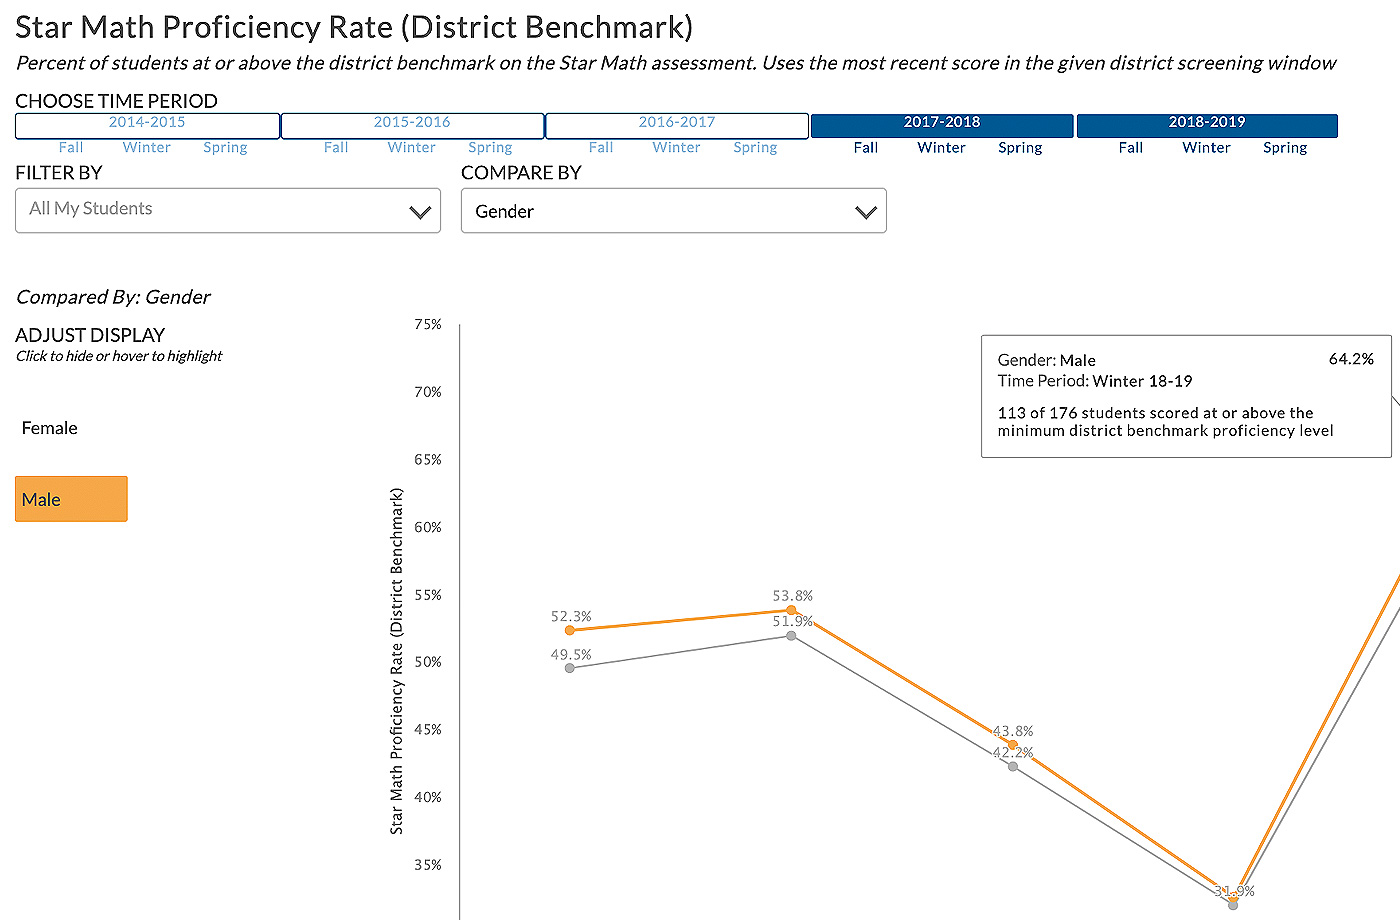
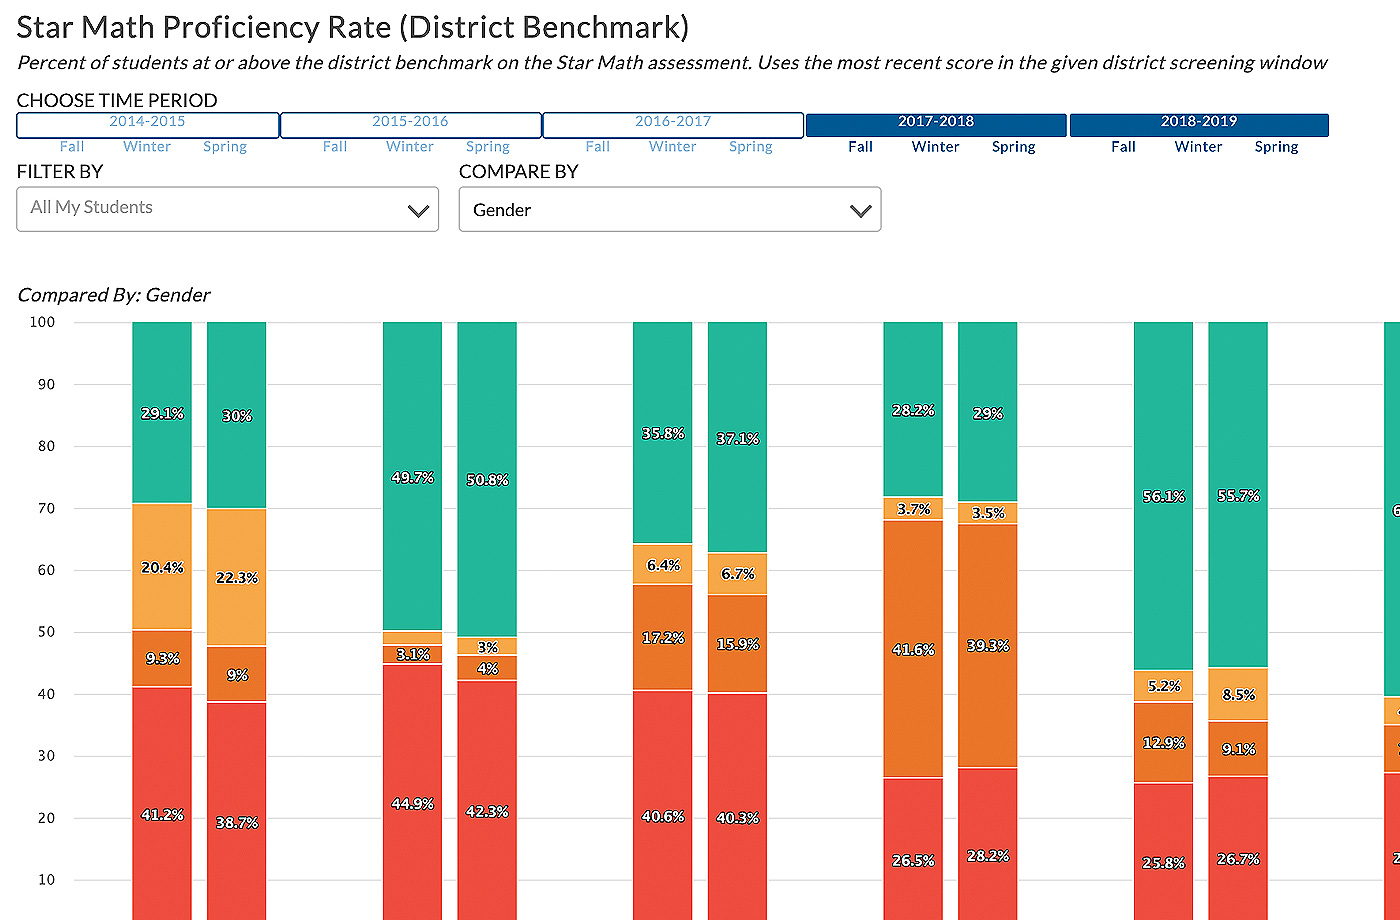
Now more than ever, district leaders need to understand where their students are, where they should  be, and what they can do to help them get to where they need to be. Schoolzilla supports both in-person and remote learning and gives you a full-circle view into academic issues and challenges so you can make informed decisions about how to accelerate student learning.

Schoolzilla academic achievements screenshots
Schoolzilla Absenteeism screen

Attendance

Better understand attendance trends across the district by easily identifying which schools might need the most supports—as well as which groups of students are the most chronically absent.

Behavior trends

Easily identify behavior patterns by leveraging data that shows bright spots and areas for additional support. Uncover which students or groups are overrepresented in office referrals and suspensions so you can develop positive behavior supports.

Behavior trends
Equity at the center

Equity at the center

Keep all students on the path to success by viewing progress by student ethnicity, English Learner status, Special Ed status and more:

  • Configure demographic groups to match your unique district compositions
  • View progress across schools for different student populations
  • Compare within student demographic groups to monitor equity for all

Now that we are working with Schoolzilla, we have immediate, seamless access to our data in real time. We can see a high-level overview, and we can drill down to get answers to questions that we have.

Dr. Luke Neff • Director of Instructional Technology, Newberg Public Schools

Brochure

Learn more about how Schoolzilla gives you the data you need to lead.

On-Demand Webinar

Understanding District Performance During Uncertain Times

Experience Schoolzilla in action

On-demand demo

Got two minutes?  Take a quick visual tour of our dashboards and see how Schoolzilla makes your data accessible and easy-to-understand

Meet Schoolzilla

Let’s talk about introducing Schoolzilla in your school or district!

Select your school

Searching for schools in ZIP code ---

Loading schools…

Don't see your school?